

Last year on Simple, as we approached a big milestone of 1 million registered patients, we started receiving feedback from healthcare workers about long loading times and overall slow performance in the app.
In an app for healthcare workers where every second counts, performance can quickly become a bottleneck in the success of the hypertension program. So we set out to investigate the cause of these issues by applying one of the First Principles of engineering at Obvious–Theory of Constraints. Identifying the most important limiting factor is the key and improvements made only at this constraint, will get the desired outcome.
Making improvements into any legacy system can be broken down into three repeatable steps:
🔎 Identify: how we added observability to our database queries
❌ Eliminate: how we optimised one of our critical queries — searching for a patient was brought down from ~9seconds to <800ms for a 40k patient dataset
📊 Measure: how we set up regression testing and service level objectives (SLOs) to ensure we maintained that performance.
🔁 Repeat
Identify: Observing the queries
On Simple we have hundreds of queries with varying complexities. Some are as simple (no pun intended) as fetching a single record for a patient, while others involve joining different tables and using filters or grouping to get the results.
But complex queries don't necessarily mean that they are the biggest performance bottleneck. Often, even a simple query without proper indexing can perform worse than a well written complex query with indexing. This meant we need data to identify our most important limiting query in the business critical flows.
We connected with Gaurav Lochan, who was one of the principal engineer at Whatsapp, who had experience working on database performance issues at scale. This gave us insights into how can we add observability in the system.
Measure and report metrics on time taken by queries
Set up dashboards to observe query performance over a period of time
This helped us observe if query performance is getting better over time.
Report performance metrics
Before we could set up our dashboards, we needed to get our database metrics from production. We were using Room to save our data in a local database, and while that was a good ORM library, it did not provide an API to measure our performance metrics in production out of the box.
So, we instead wrote a plugin that did byte code transformation to modify the generated Room code, to add a measureAndReport function. This simple function measured the time it took for the block to execute and report it using the Room Dao class name and function name, and helped us when viewing the data.
private static <T> T measureAndReport(
final String methodName,
final kotlin.jvm.functions.Function0<T> block
) {
final long start = System.currentTimeMillis();
final T result; $REPORTER_NAME$.begin("$CLASS_NAME$", start, methodName);
result = block.invoke();
$REPORTER_NAME$.end("$CLASS_NAME$", start, methodName);
return result;
}
However, with this approach, we were unable to measure queries that use Android paging as these are called lazily.
Hence for all paginated queries, we decided to use regression testing instead. We measure the time taken using a blocking call on the paging source. In the future, we’d like to replace it with a custom PagingSource implementation that can report metrics from production.
You can take a look at the implementation of this over in this PR. We are also exploring making this a separate Gradle plugin. It's still a WIP, but you can take a look at it over here.
Set up performance dashboards
Now that we’d started reporting these metrics from production, we needed to set up dashboards that could show us how these queries are performing.
We tried a couple of services like Mixpanel & Firebase, but finally decided to use Datadog, because we were looking for custom dashboards and SLOs with alerts.
We set up a dashboard that shows how the database queries are doing at 95th and 99th percentile to cover largest percentage of our users.
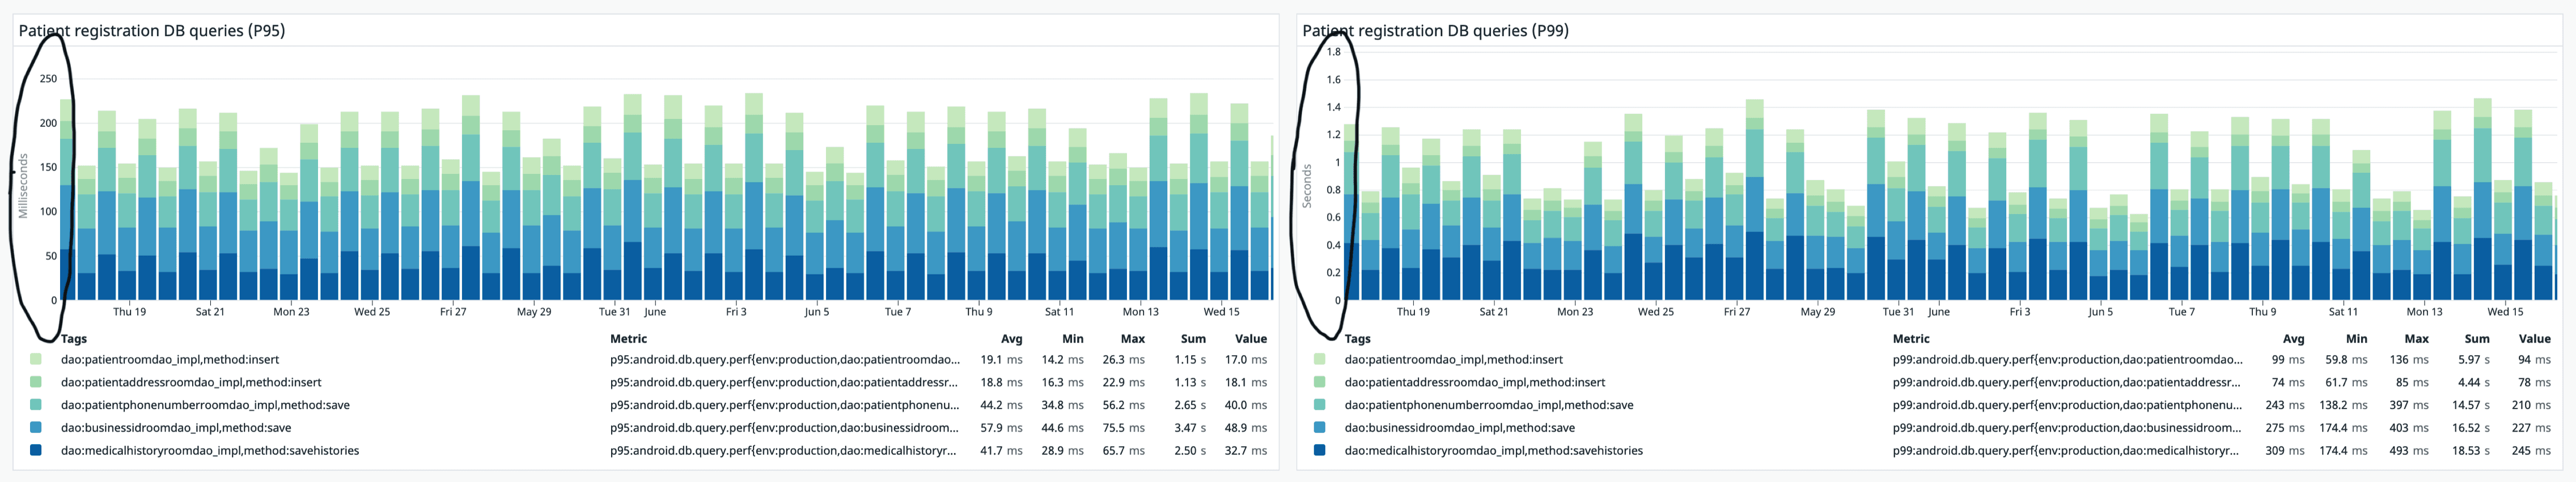
Graph that shows the search query timings during benchmark testing
With these dashboards and metrics in place, we were able to create a list of queries that needed to be optimised for performance in our critical flows first. One such critical flow was searching for a patient. Since this was the starting point for registering any patient, it was important for this to be as fast as possible and reduce the overall patient registration flow time too.
Eliminate: Optimising a search query
What does it take to optimise a complex search query that fetches information across multiple tables? Here is what the search query on Simple looked like.
In order to optimise, we first ran EXPLAIN QUERY PLAN on the search query. This allowed us to understand how the query is executed, and moreover, show if database indices are being used or not.
The Explain query plan broadly gives one of the following results along with some additional metadata:
SEARCH TABLE USING INDEX - Great! You are using an index.
SCAN TABLE USING INDEX - Acceptable. SQLite is using an index but not necessarily the one we defined, but it still does the table scan.
SCAN TABLE - Avoid this if you're using any conditions in your query, it does a full table scan
For search query, the EXPLAIN plan showed that SQLite is performing a full-table scan instead of using indices and creating temp tables to store intermediate results in the search query. This was leading to substantial delays in running search.
With this valuable information, we made the following optimizations to the search query:
Indexing. A few of our JOIN statements were not using indices, which meant that they were doing a full table scan. We decided to add an index for those tables to speed up the search.
Temp Tables. We noticed that temp tables were being created in order to calculate patient’s last seen date and facility. This involved fetching dates from three different tables. While it was possible to index columns in those tables to improve the read performance, it would end up affecting the write times as well. Instead, we questioned the relevance of showing this information to users in the first place. We brought in the product folks and after much deliberation, decided to remove the last seen date altogether. Now we only show last seen facility which is much more useful and less expensive.
FTS. While the first two changes got the query time down from ~9 sec to ~4 sec, it was still not acceptable to us. So, we started digging again, and found our silver lining. We were using INSTR in the search query that becomes sub-optimal as your dataset starts to grow. We figured that SQLite provides a better approach for search queries i.e. full-text search (FTS).
We changed our query to use FTS instead and measured it through regression testing. We ran the test on a dataset of 40k patients on Xiaomi Redmi 8A (most used device for Simple). The results were amazing!
From 4 sec, it took less than 800ms to search for a patient now. When closer to the results (as we enter the full name) the query time was as low as ~60ms.
It is worth mentioning that there were a couple of trade-offs to using FTS. One being that we could no longer support sub-string search but since our users prefer first name searches, this was acceptable. FTS also did not allow us to fully control ordering of the search results in the way we wanted. In the end, this trade-off was not worth the performance cost. If needed in the future, we can solve this by writing a custom ranking function in FTS.
Measure
While we improved the query performance, we wanted to make sure that it is not getting worse over time and ran benchmark tests regularly on our CI.
Setting performance targets
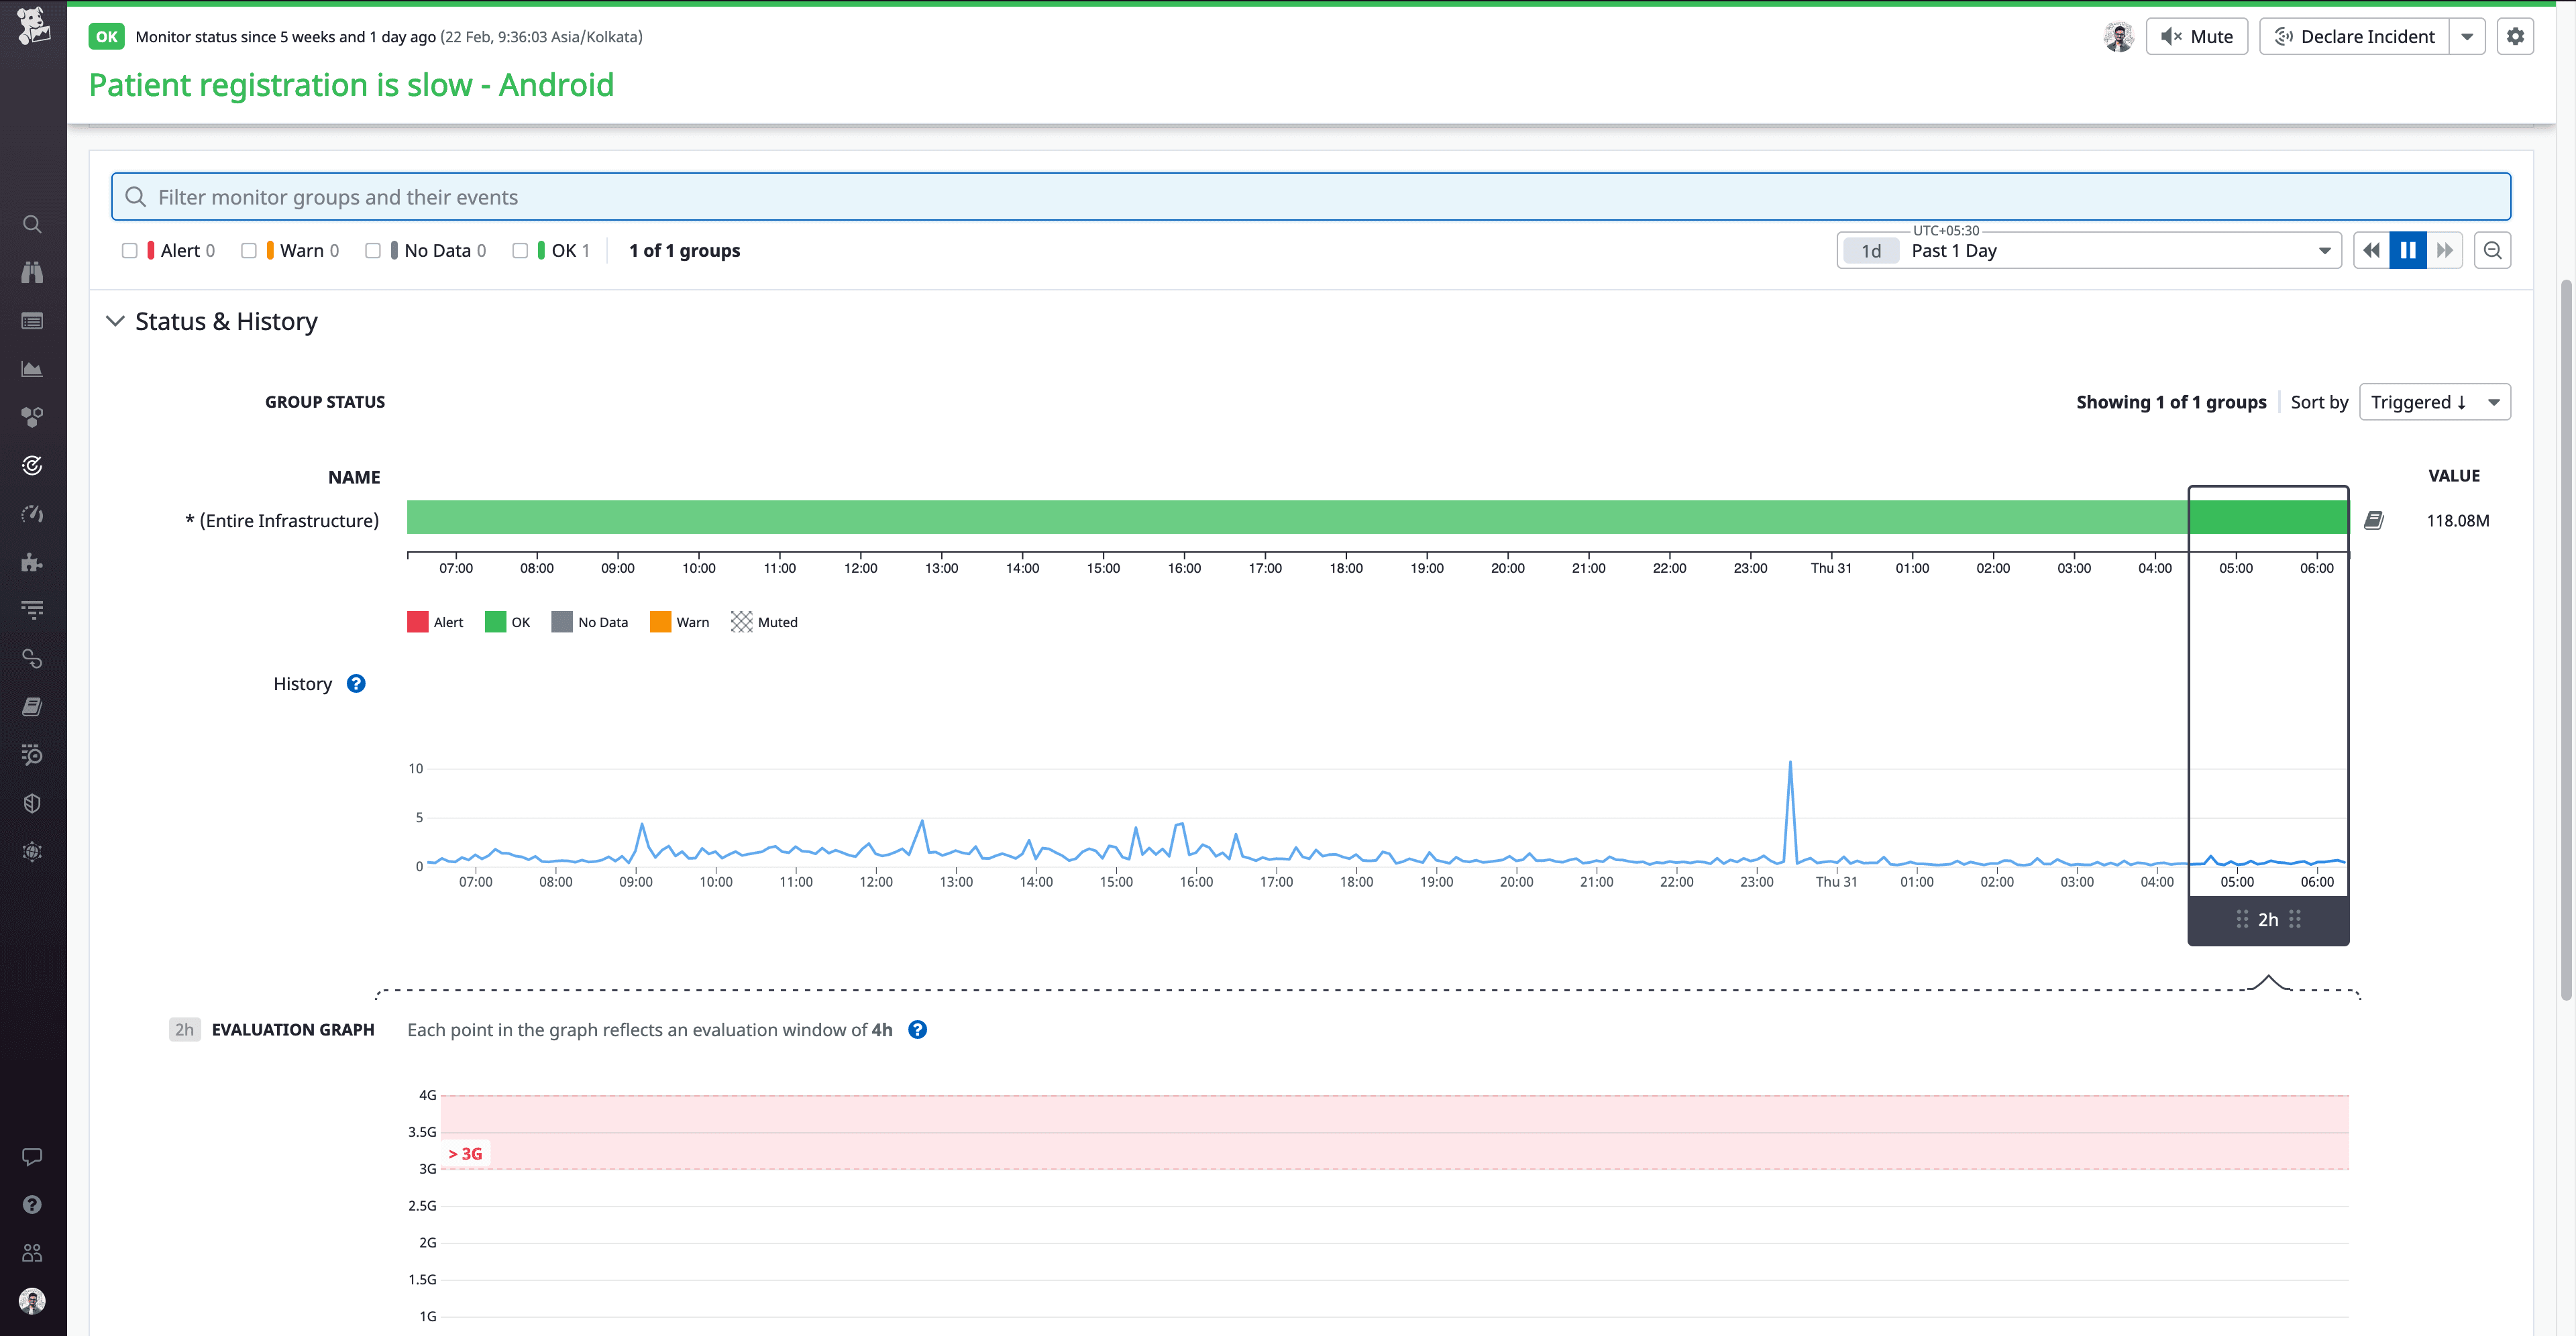
We setup SLOs to define clear performance goals for all the business critical P0 flows. In case of any breach to SLOs, we get notified on Slack and email. This has helped us maintain performance consistency upfront rather than waiting for users to report issues.
Here is an example of an SLOs. We set a performance target of 3 seconds on patient registration query based on the current app usability. We will be notified if the query takes longer than 3 seconds.
Benchmark Testing
While it is possible to make improvements to a query, run it in a debug environment and check the metrics on our Datadog dashboard, it involves a lot of manual work. We needed faster feedback loops for improvements at the constraint. We are running these tests on CI every time a change is merged into our main branch to ensure we are monitoring the performance.
So we proposed and set up benchmark testing that could run the query multiple times and report the aggregate time to Datadog. We setup a different dashboard to look at these timings. We also decided to make our test dataset closer to production data. Here is an example of manually running benchmark test on the search query.
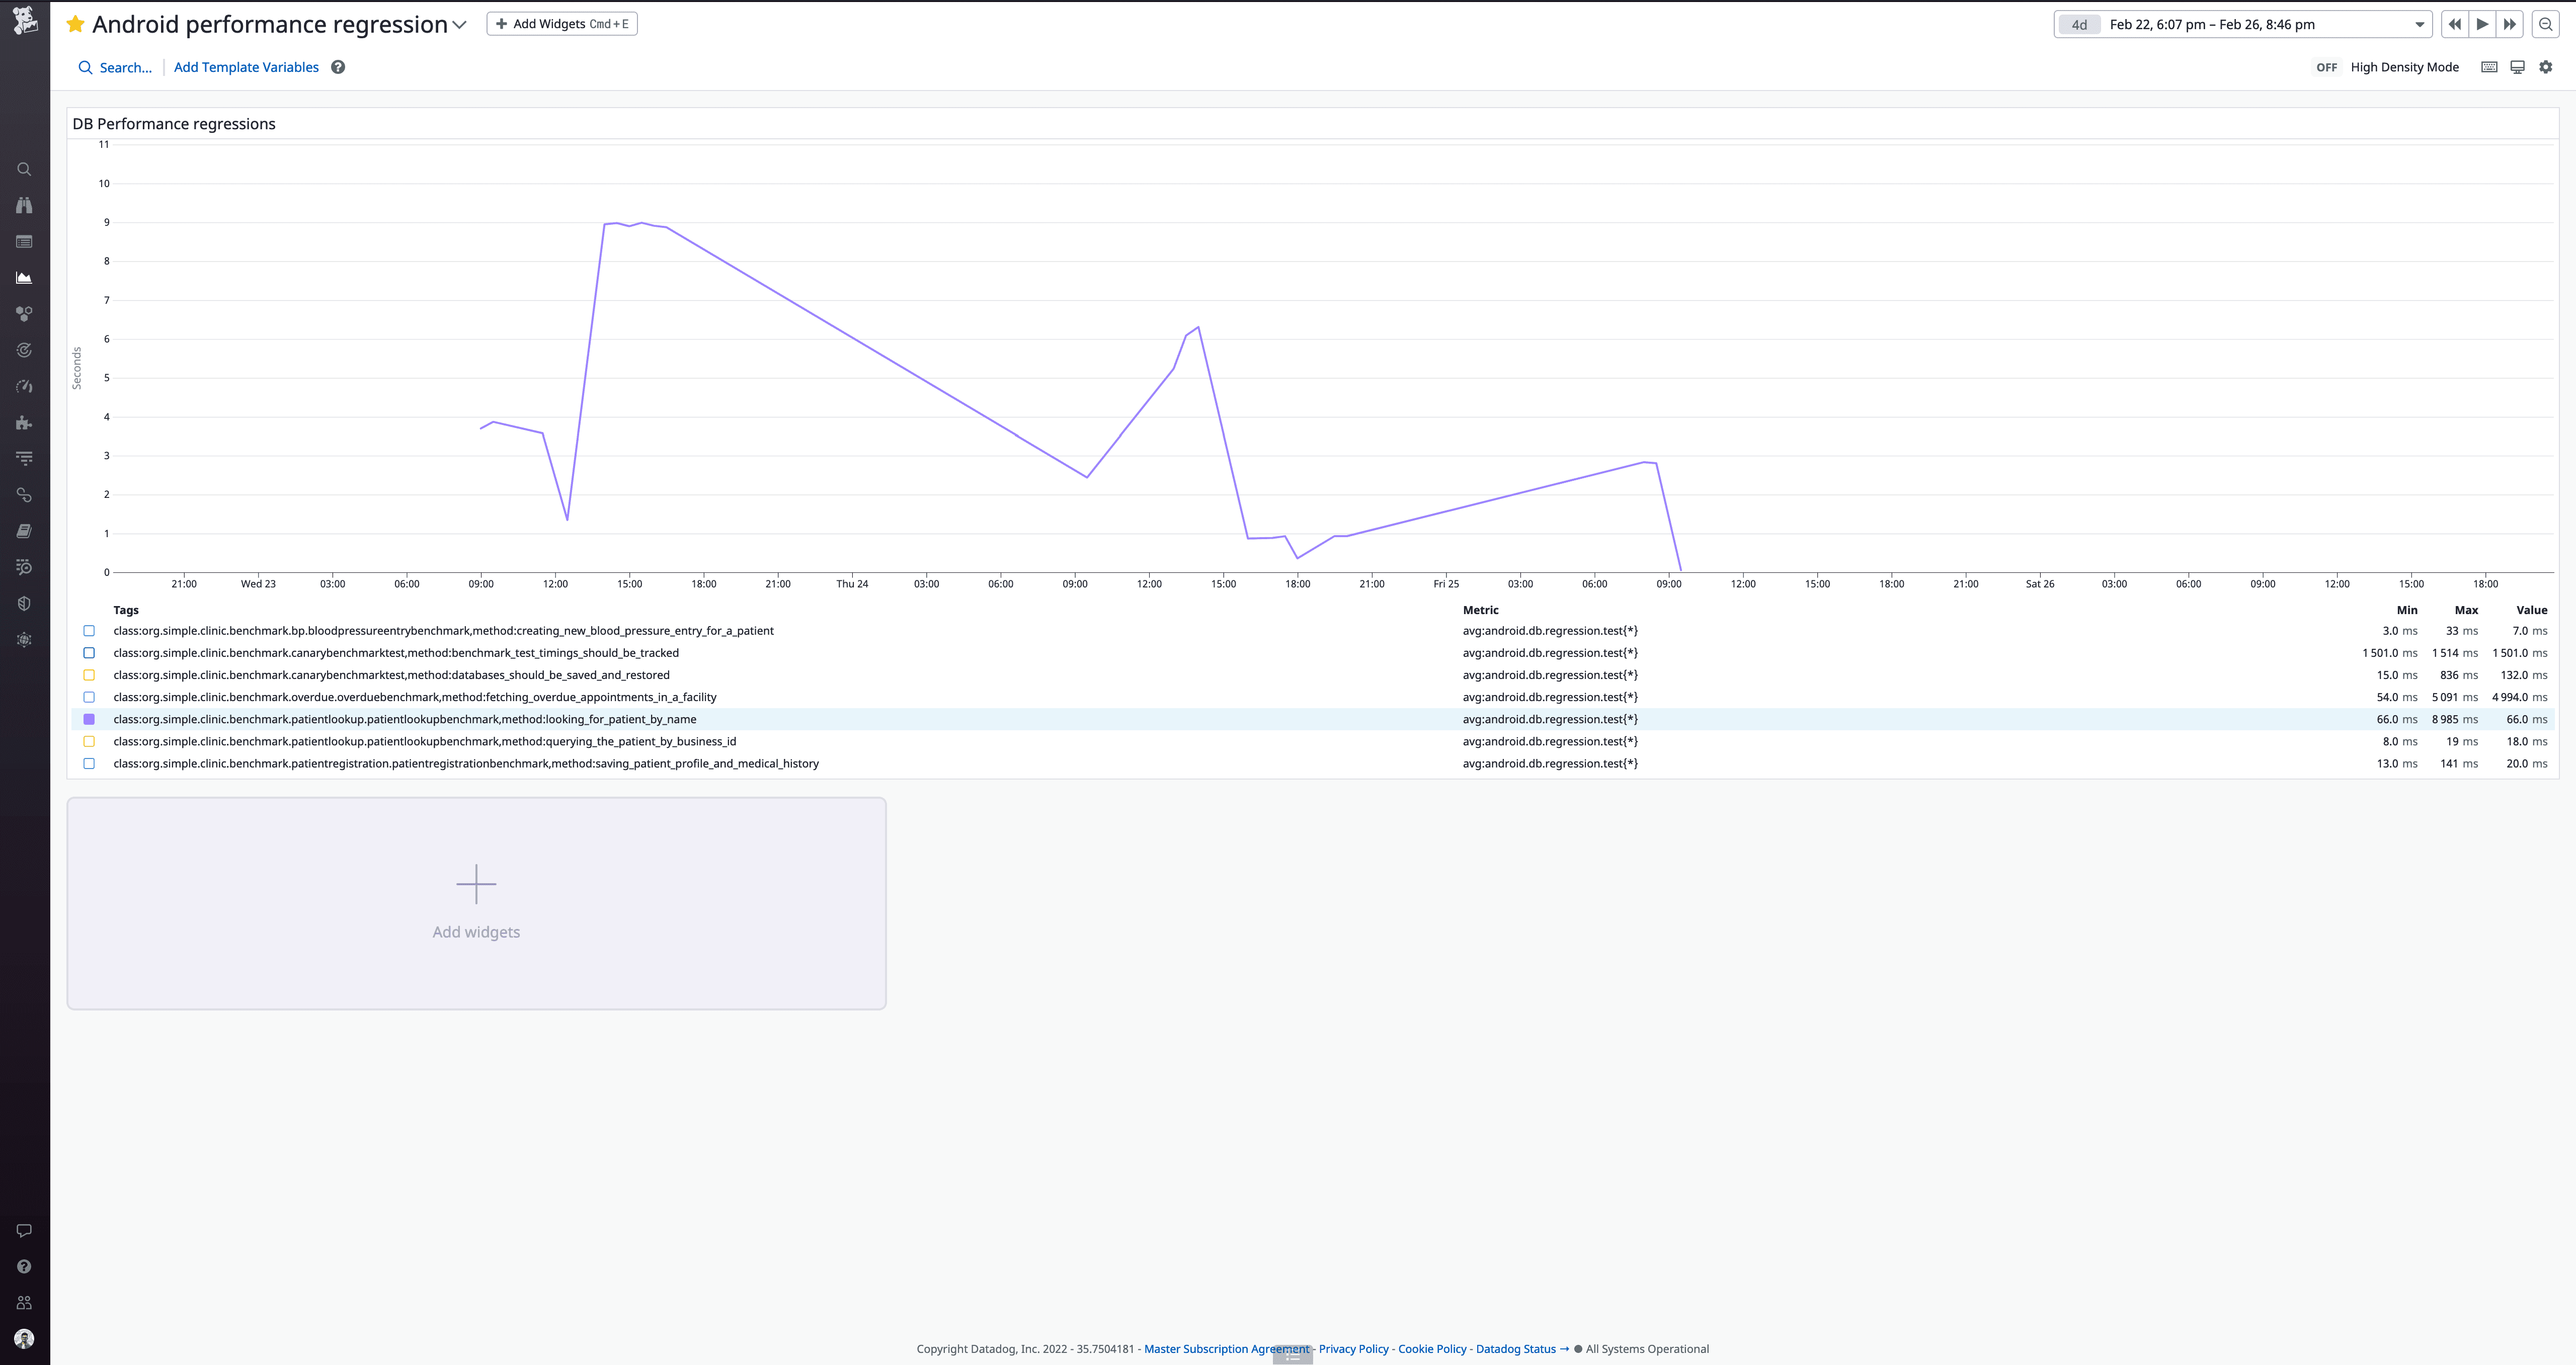
Graph that shows the search query timings during benchmark testing
Some of the upward trends in the graph were us playing around with the query to confirm the changes were working as intended. This set up helped us measure whether the changes we were making were working efficiently before we merged them to our main branch and shipped it to users.
Wrapping it up…
We repeated the process of identifying constraints, eliminating them and measuring over time to improve performance throughout the app.
Here are couple of other queries where we improved the performance in critical flows of the app
Overdue appointments for a medical facility: ~6 sec to ~790 ms
Recently visited patients (latest 10 patients): ~2 sec to ~830 ms
All recently visited patients in a facility: ~4 sec to ~1.9 sec
These kind of improvements to our critical flows allowed us to improve our overall product metrics. Like bringing down how much time users spend in the app vs performing actual patient care. We took a structured approach to identifying the issue, eliminating it and measuring it to make sure it continues to do well.
In Apr 2022, 8 months after we started working on improving search query time, Simple reached 2 million registered patients. With more patients than ever before on Simple, we feel compelled to continuously improve app performance in small ways.
Header illustration from Freepik